
Author: Atul Pradhananga
Dashboards are an effective way of presenting data-based information through an integrated UI system from multiple components into a unified display, by which a user can obtain relevant, actionable data. This data enables a user to monitor important stats and Key Performance Indicators (KPIs) crucial to their business.
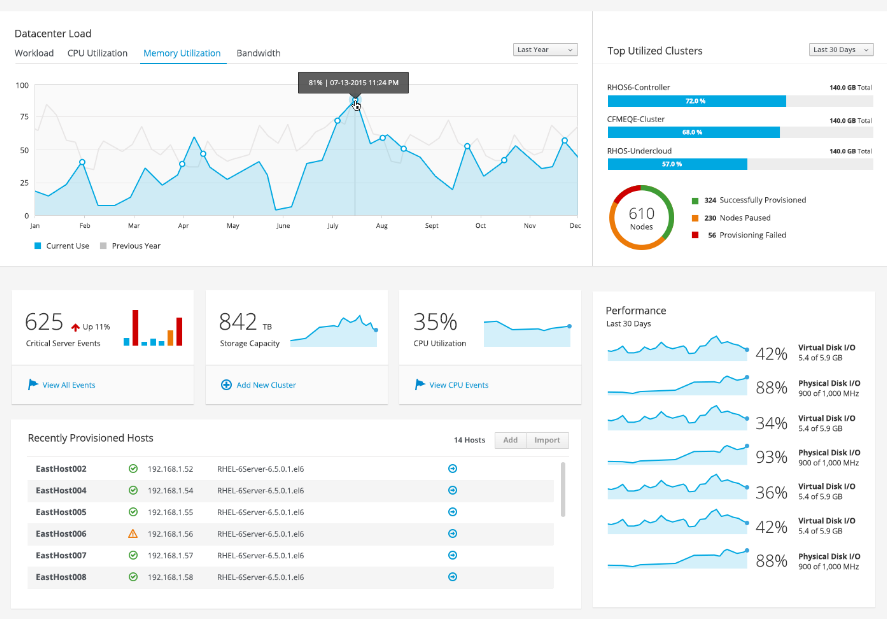
Designed correctly, dashboards help in distilling a large amount of complex data into simple & clear sections, arranged in an easy-to-scan format that can be monitored at a glance.
Here are 3 tips for designing more effective dashboards in Power BI:
1. Organization
When organizing a large amount of information, every decision should be guided by a hierarchy of what information is most important to the user. The most important information should stand out more and should be clearly and quickly understood by the user.
Dashboard content must portray the nature of the information being conveyed and supports efficient and meaningful reporting.
Information cannot be placed just anywhere on the dashboard, nor can section of the display be sized simply to fit the available space. Items that relate to one another should usually be positioned close to one another.
— Stephen Few, author of Information Dashboard Design
Before starting to design a dashboard, ask yourself these questions:
- What is the most important information and where should you place them?
- How about the secondary supporting information?
- How do you lay out charts and text to enable consistency and clarity?
- How can white space tell a clear story and help your audience absorb information?
2. Appropriate Visualizations
Raw data consists of many different and connected components. It is often complex, difficult to digest and tedious to read over. Visualization plays a vital role in distilling this complexity and presenting relevant information to the user in a short amount of time. Visualizations should be used to consolidate the basic raw data and convey specific high-level information in an effective and efficient manner.
There is magic in graphs. The profile of a curve reveals in a flash a whole situation — the life history of an epidemic, a panic, or an era of prosperity. The curve informs the mind, awakens the imagination, convinces.
―Henry D. Hubbard

Your visualizations should support the following questions:
- What information do the users care about the most?
- What are the other crucial details they need in addition to that?
- What type of information you are trying to convey to the users?
3. Reduce complexity
The purpose of a dashboard is insight, not pretty pictures. When designing dashboards, you need to filter out all the unnecessary data and be selective about what you display. You should also be careful to not bombard the user with all the data visualization methods you have access to. Keep it simple. Use the design principles to reduce visual clutter or complexity.

If you want to learn more, here are more resources you can dig into:
- 5 Psychological Principles for Designing Better User Experiences
- Microsoft Power BI Guided Learning
- Dashboard Design User Experience Guidelines
At Dogma Group, we help you keep up to date with the latest market trends and insights in CRM, ERP, and related technologies. Subscribe to our blogs to learn more. Contact us today for a no-obligation consultation on 01296 328 689. Or email us at info@dogmagroup.co.uk